Spectrogram, Spectral analysis and Wavelet analysis
DataView has time-frequency analysis facilities, including:
Sonogram
Short-term Fourier transforms allows examination of the time-varying frequency
components in a signal. Averaging increases the accuracy of the power measurement
of each frequency bin, while partial segment overlapping increases the time
resolution of the analysis.
An audio file (wav format) has been loaded into
DataView and the time-frequency components are displayed as a sonogram.
[This is a screen-capture recording of clicking the Play button within the dialog.]
The sonogram can be displayed in rotatable 3D, which may be
informative, and certainly looks nice.
Spectral analysis
Standard stationary spectral analysis can be accomplished by selecting a time-slice
through the sonogram.
Left or above: A mixed sine wave containing components at
5, 20 and 100 Hz. 1.2 s of data were sampled at 1 KHz.
Right or below: The output from stationary spectral analysis shows the
3 frequency components in the data. In order to achieve the required resolution
with the available record length, the data were decimated to a frequency
of 250 Hz.
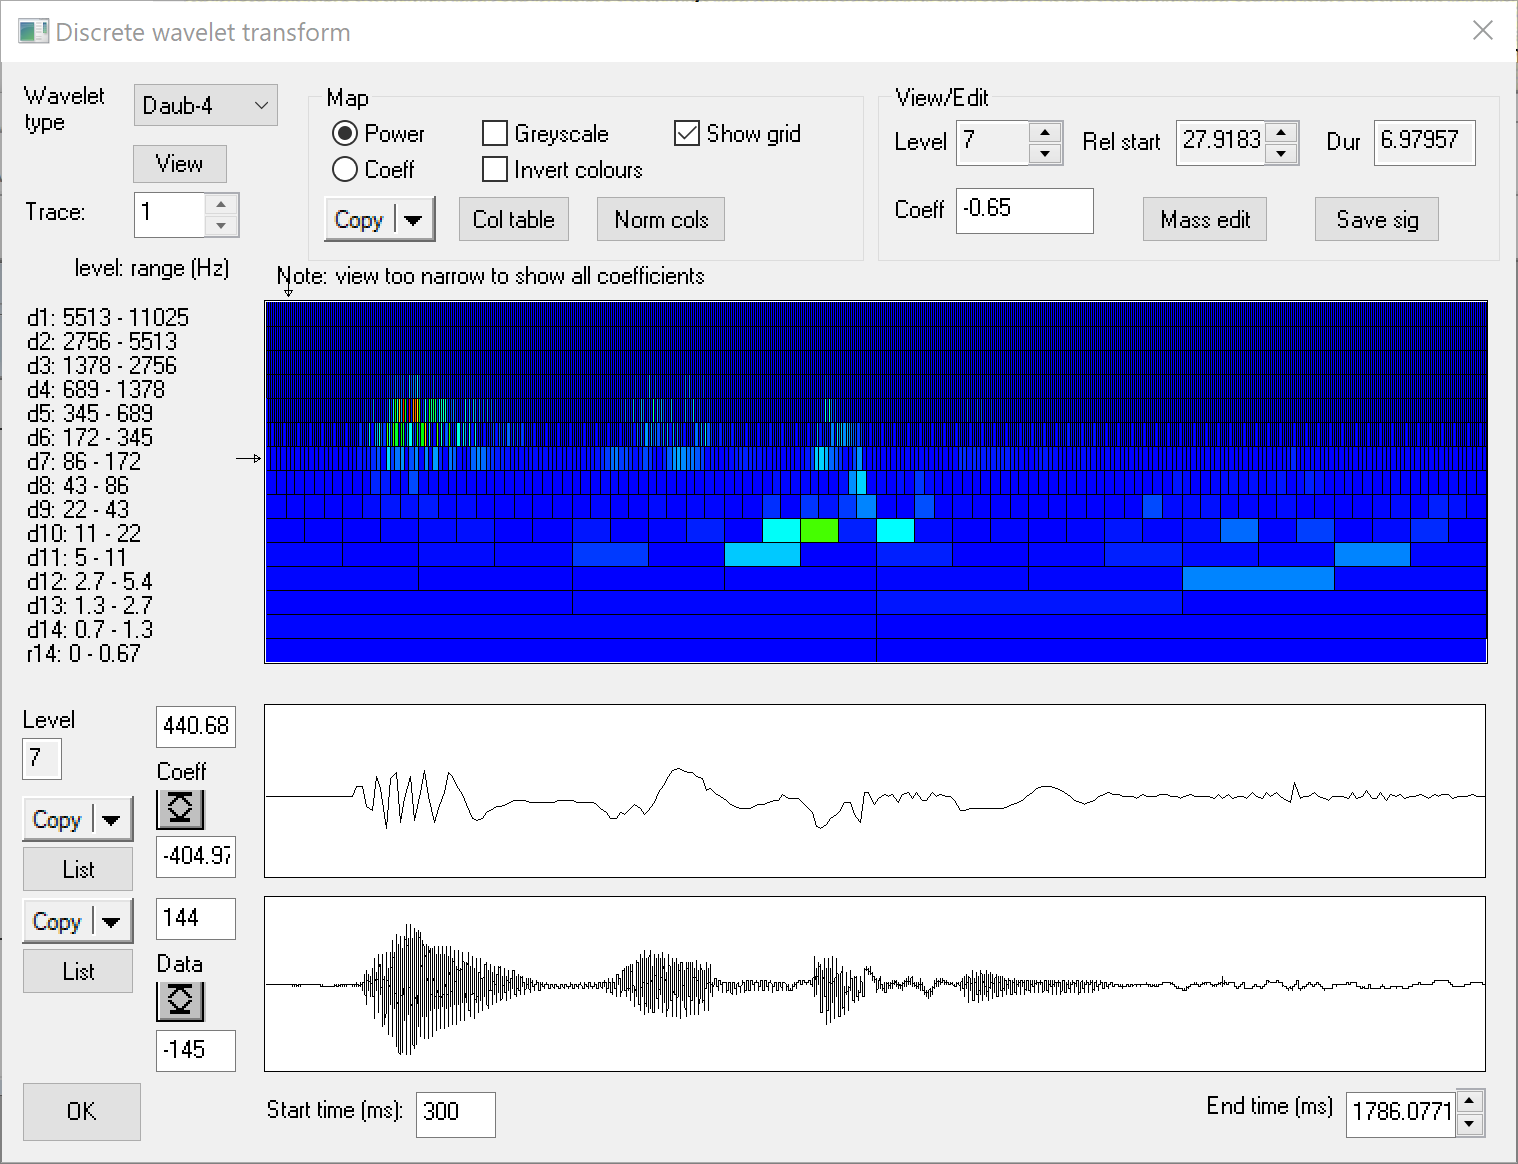
Wavelet Analysis
DataView can analyse waveforms using the discrete wavelet transform (DWT), which in some ways is similar to the short-term Fourier transform.
The end result is a 2D "map" showing the relative energy at specific frequencies over the duration of the data.
The higher the frequency, the more fine-grained the time resolution of the analysis.
DWT analysis of the same sound as shown in the sonogram above.