Extracellular recording detects the activity of multiple nearby axons, and the spike waveforms generated by each axon will often have a distinctive amplitude and shape. A common task is to try to sort out how many axons are active, and which spikes come from which axon. The analysis typically falls into two distinct steps: detecting spikes in terms of distinguishing them from background noise, and clustering the resulting waveforms in terms of their similarity.
In DataView spikes can be detected either by template recognition, i.e. looking for sections of waveform that have a "spike like" shape, or simply threshold crossing. Once detected, waveforms can be clustered based on several parameters, including principle components, wavelet coefficients, voltage profile, or extracted parameters such as peak-to-peak duration. Clustering can be peformed using either a 2D or 3D scatter graph.
Clustering can be manual or automatic.
Manual clustering requires the user to select a cluster by drawing around it in the graph, and then apply a colour to distinguish it from other clusters.
Automatic clustering uses an expectation maximization algorithm developed by Charles A Bouman. You can either pre-select the number of clusters, in which case the system partitions events into that number of clusters, or you can allow the algorithm itself to choose how many clusters are present in the data.
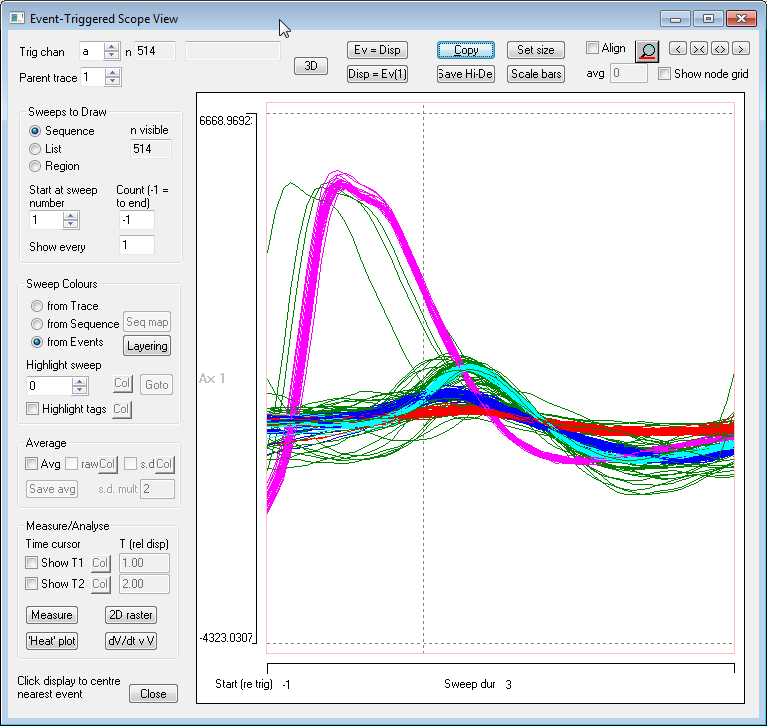
Examination of the spike waveforms in the Event-Triggered Scope View shows the categories revealed by clustering